

Education and financial literacy will help narrow the wealth gap cross-culturally.
Our mission is to educate middle and high school students about financial literacy. We believe that providing them with the necessary tools and resources related to financial literacy will help narrow the wealth gap cross-culturally. Cobb Global Outreach Inc. believes in education and inclusion for all Americans.

After a life-changing event in 1999, I faced immense challenges but rediscovered my purpose through faith. That purpose became Cobb Global Outreach Inc., where we teach financial literacy to help students break free from poverty. Learn how personal hardship transformed into a mission to empower the next generation.


Providing Scholarships
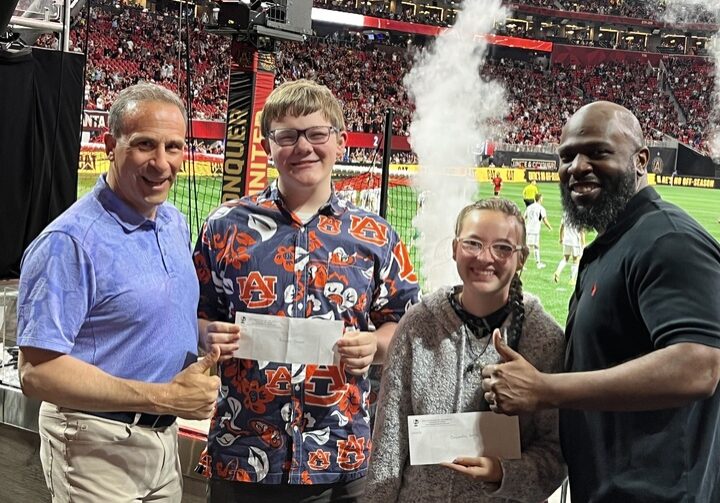
At Cobb Global Outreach Inc., we are committed to breaking down financial barriers that prevent students from pursuing higher education. Our scholarship program gives deserving middle and high school students the chance to further their education, equipping them with the skills and opportunities needed for long-term success. More than just financial aid, these scholarships are an investment in the future leaders of our communities, helping to increase financial literacy and empower the next generation to reach their full potential.
Financial Literacy for Our Youth
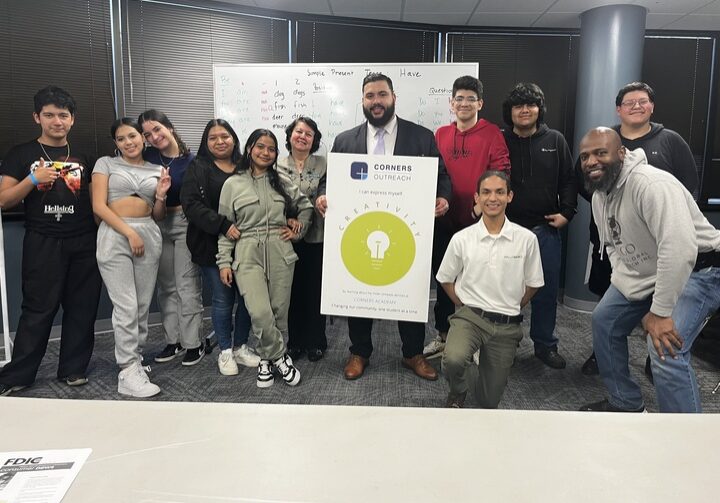
Our mission is to provide young people with the financial literacy they need to navigate life's challenges and opportunities. Through our programs, students learn how to manage their finances, understand key financial literacy terms, and develop wealth-building strategies that will benefit them for life. By teaching these skills early—starting as young as 6th grade—we empower youth to make informed financial decisions, build confidence, and secure a brighter, more independent future.


Closing the Wage Gap
We are dedicated to addressing the wage gap by empowering students with financial literacy and access to opportunities for economic growth. By teaching students how financial literacy helps bridge income inequality, we tackle the systemic barriers that contribute to the wealth divide. At Cobb Global Outreach Inc., we believe that equipping young people with these critical skills is key to narrowing the wealth gap, one student at a time.
What people say about it
"The Cobb Global Outreach scholarship graciously offered me a hand of financial assistance through a relatively simple application process. Since receiving my scholarship funds, I have used them to purchase all the required books in all my classes (a bill of more than $700). The remaining funds have not yet been used, but I will most likely use them to pay for small expenses such as snacks and other groceries or the cost of laundry. The Cobb Global Outreach program is aware of the increasing cost of college and the pressure it places upon students, and they are making an active effort to mitigate this pressure through its generous scholarship foundation. This assistance has helped both other students and myself to focus on what truly matters when at college—self-betterment and education"
Dalton Goodson
2022 Recipient
"The Cobb Global Outreach Scholarship will allow me to purchase the textbooks I need for the courses I am taking this year. I'm incredibly grateful to have the support of Cobb in order to focus entirely on my classes without having to worry how I will afford the material necessary for success. I am able to learn from some of the brightest people in their field and engage with the courses on a deeper level without added stress thanks to this opportunity. College is a difficult transition for any family, but I know my family appreciates the support of Cobb’s scholarship as I move across the country to pursue an invaluable education. Without the added burden of class materials, I’m able to visit home more frequently without worrying over the expense. On a personal note, I know there are people who believe in my and my future successes which is an incredible feeling."
Alana Esposito
2022 Recipient
"I was a recipient of the Cobb Global Outreach scholarship and I just wanted to thank you for this opportunity to help with my college tuition. It’s been a huge help especially since HU is a private institution. This scholarship means the world to me as I am currently a student matriculating through Howard right now — It’s a great help, especially when it comes to dental school following my undergrad years. Being awarded this scholarship means that someone believed in me and my journey, and I am forever grateful for this opportunity. I look forward to achieving and striving for my future goals!"
Cambria Johnson
2022 Recipient
"I would like to thank Cobb Global Outreach for selecting me as a scholarship recipient. Receiving this scholarship has helped my family and me cover the cost of some tuition throughout my freshman year of college. Being from a low-income family it is hard
even considering a higher education due to a lack of funds. When informed that I was a recipient of the scholarship it motivated me to work harder. I’m currently a sophomore attending Alabama A&M University majoring in Civil Engineering. This scholarship has given me the opportunity to continue my education and spread information about Cobb Global to other students. I encourage others to apply so they can have the same opportunity as me.
Keltrick Jakes
2021 Recipient
